01
⬡
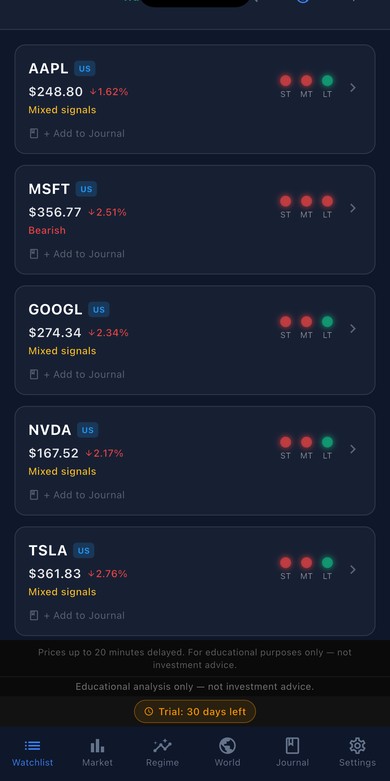
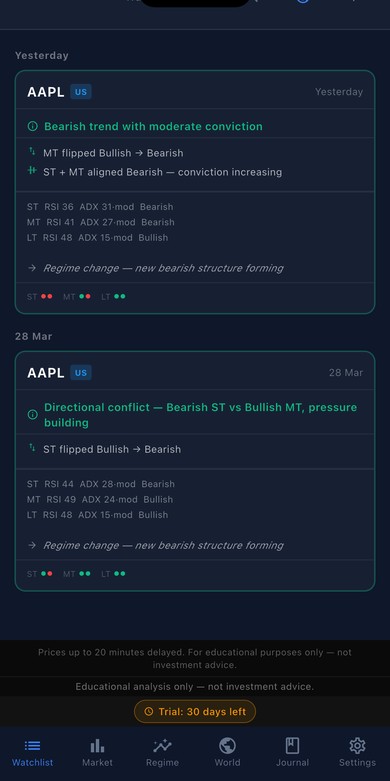
Regime Detection
Bull, Bear, or Sideways classified independently for Short, Medium, and Long Term timeframes. Confidence-rated (Low/Moderate/High) with ADX Wilder smoothing, RSI momentum, and ATR volatility. Full indicator breakdown on tap.
EMAADX WilderRSIATR3 Timeframes
02
◈
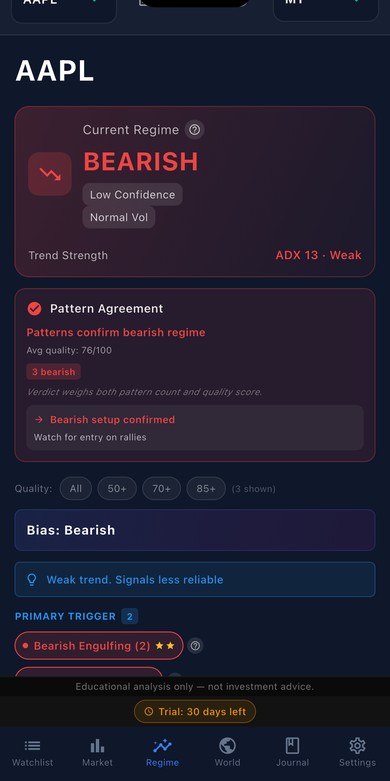
Pattern Agreement
15+ candlestick patterns detected on timeframe-appropriate candles. Each scored 0–100 for quality, classified by type (Primary Trigger / Rejection / Indecision), and checked for regime alignment. Pattern Agreement card scores overall confirmation.
15+ PatternsQuality 0–100Regime Alignment
03
◉
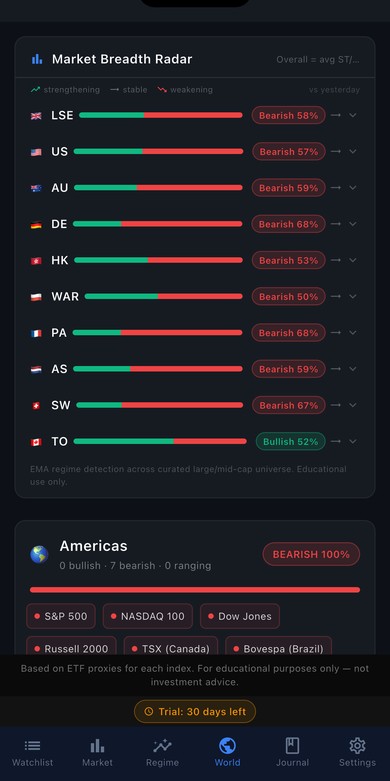
Market Breadth Radar
Bull/bear split across every exchange, updated daily. 28 global indices across Americas, Europe, Asia-Pacific, and Emerging Markets. Breadth trend arrows show strengthening or weakening vs yesterday.
28 Indices4 RegionsDaily Update
04
▦
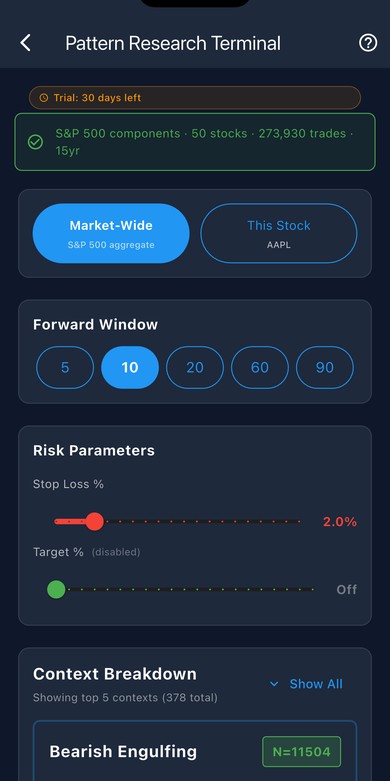
Pattern Research Terminal
2.5M+ historical trade occurrences across 10 exchanges, 15 years of data. Configurable forward windows (5/10/20/60/90 days), stop loss %, and context breakdowns by regime, volume, and ADX. Win rates with confidence intervals.
2.5M+ Trades15yr HistoryCI Intervals
05
◰
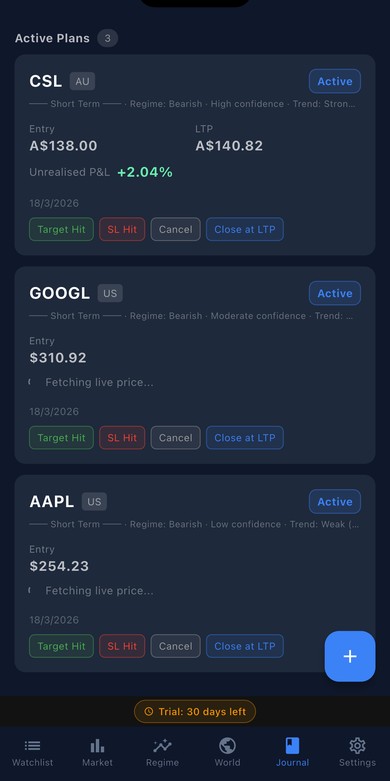
Paper Trading Journal
Log trades with regime context at entry. Track live P&L, manage Active Plans with Target Hit / SL Hit / Close at LTP. Win rate and avg P&L stats. AES-256 encrypted on-device — never transmitted.
Live P&LAES-256On-Device
06
∃
Copy as AI Prompt
Export full structured analysis — regime, ADX, RSI, volatility, patterns, breadth — as a clipboard prompt for ChatGPT, Gemini, Claude, or DeepSeek. MAZE structures the data; your AI assistant interprets it.
ChatGPTGeminiClaudeDeepSeek